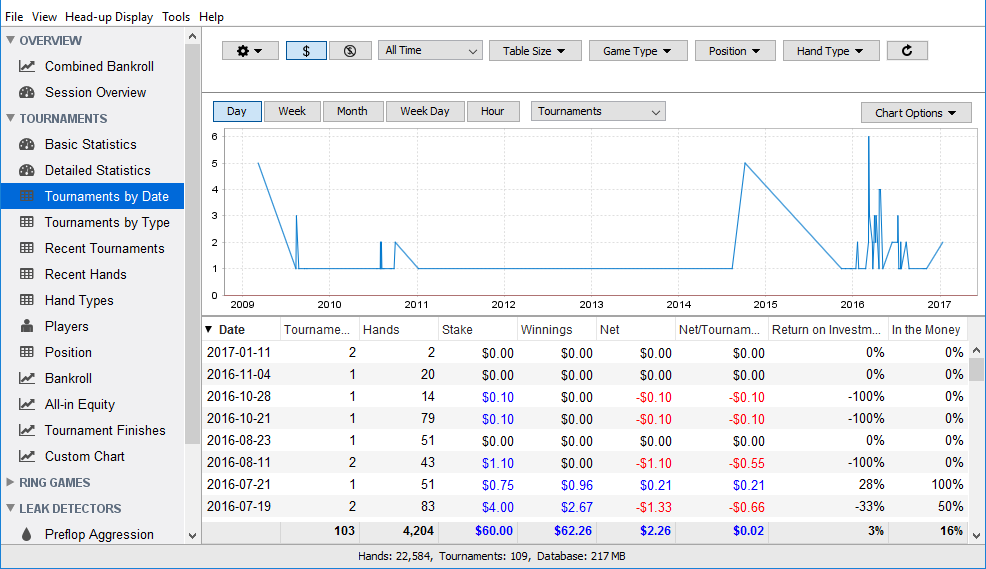
The Tournaments by Date summary helps you analyse your poker history in several ways.

The time unit used to dissect your poker activity can be:
- Day, which is the default option,
- Week
- Month
- Year
- Week Day. This lets you see if playing on Fridays in the last six months has been more profitable than grinding on Sundays, for example.
- Hour. Are there certain hours of the day in which you win money? lose money? You can adjust your playing times accordingly.
Here is a list of the different data included in the summary that can be illustrated on the chart:
- Tournament
- Hands
- Buy-in
- Winnings: Winnings is the amount of money paid by the poker room when you win.
- Net: Winnings – Buy-in
- Net/Tournament
- Return on Investment
- In the Money
The Return on Investment (ROI) ratio is an important measure of your poker performance. Here is an example: You took part in a 10 players Sit & Go with a €5 buy-in, you finished at the second place and won €13.56. Your net is €8.56 (€13.56 – €5.00). Your ROI is 171% (you invested €5.00 to win €8.56).
In the Money measures the frequency at which you end up in paid places in tournaments. If you take part in 4 tournaments in a session and are getting paid in three, your ITM percentage for that session is 75% (3 / 4).
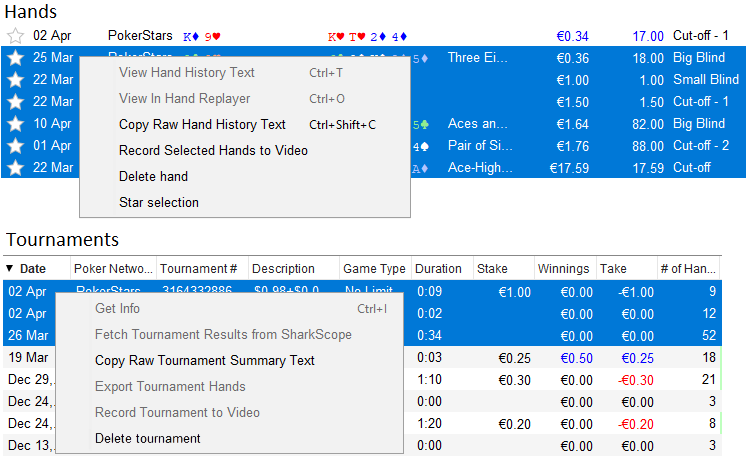
Multiple Selections You can multiple select hands or tournaments to perform some actions on desired selection. After making your selection, right click (secondary click on Mac) to see available options.

Need more help with this?
Don’t hesitate to contact us here.
